System monitoring and alerting. Keep track of your AgentHub environment's health and performance.
Dashboard
- 💚System Health - Overall system status
- 📈Key Metrics - Performance at a glance
- ⚡Quick Actions - Common monitoring tasks
Alerts
Configure and view alerts:
- ➕Create Alert - Set up new alert rules
- 📋Active Alerts - View current alerts
- 📜History - Past alert events
- ⚙️Configure - Alert thresholds and notifications
⚠️ Important
Set up alerts for critical metrics like CPU usage, memory, and error rates to proactively manage your system.
Logs
System and application logs:
- 📋View Logs - Real-time log streaming
- 🔍Search - Find specific log entries
- 📊Filter - Filter by level, source, or time
- 📤Export - Download logs for analysis
Metrics
Performance metrics:
💻 System Metrics
CPU, memory, disk, and network usage.
🤖 Agent Metrics
Response times, success rates, throughput.
📊 API Metrics
Request counts, latency, error rates.
💾 Database Metrics
Query performance, connections, cache hits.
Dashboards
Custom monitoring dashboards:
- ➕Create Dashboard - Build custom views
- 📋Templates - Pre-built dashboard templates
- 📤Share - Share dashboards with team
Screenshots
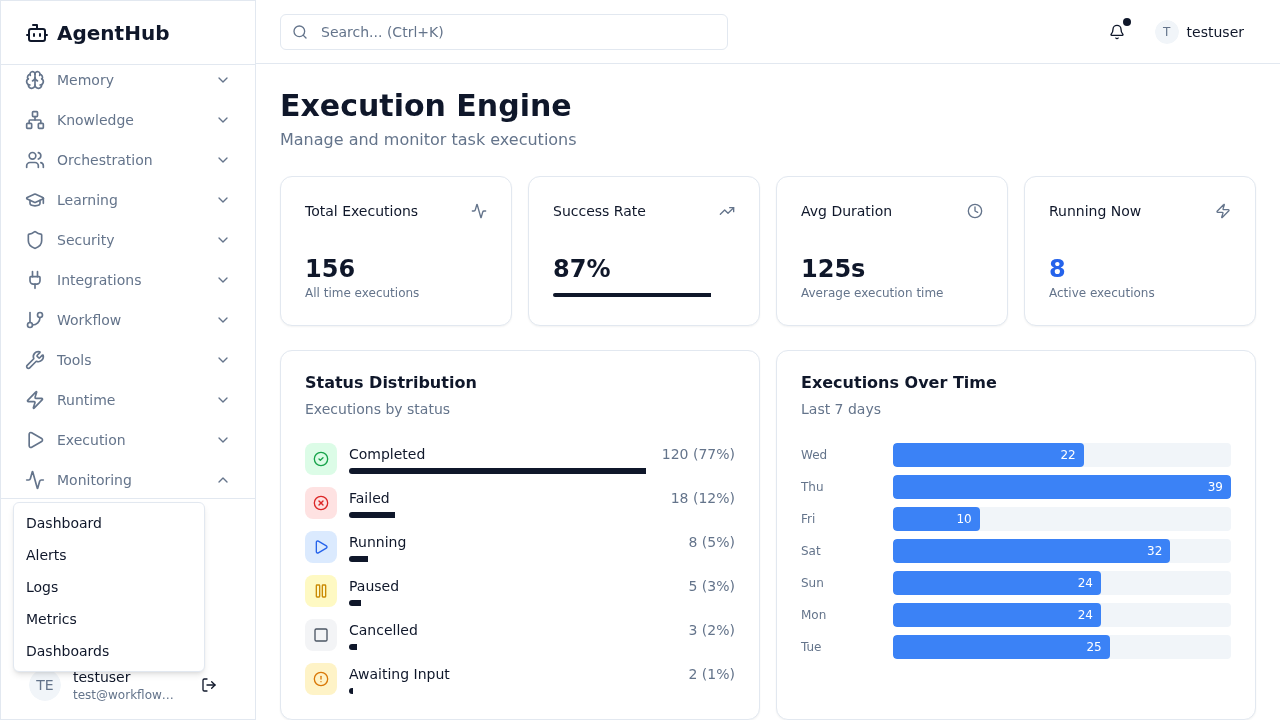
Monitoring Dropdown
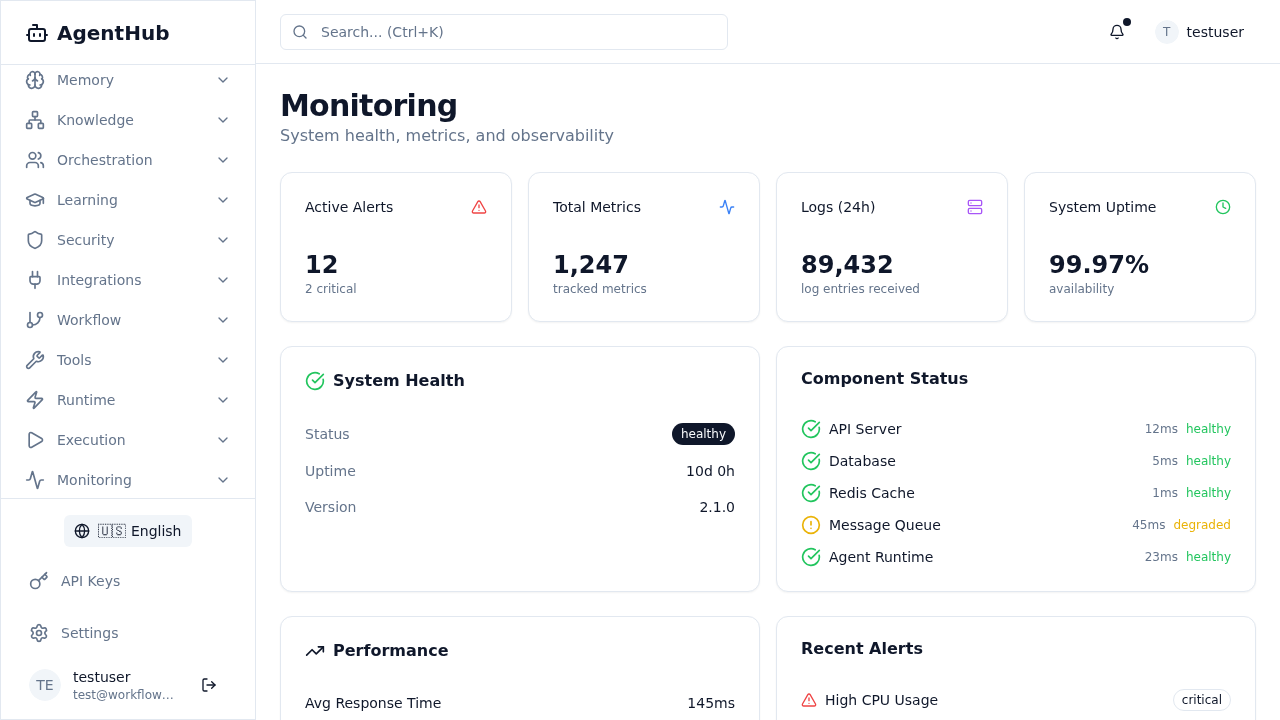
Monitoring Dashboard